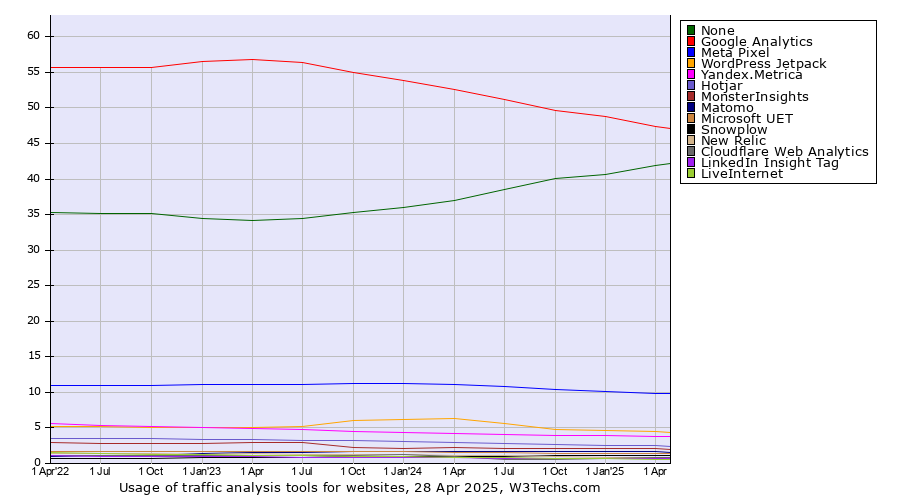
Technologies > Traffic Analysis Tools > Usage Trend > Quarterly Historical quarterly trends in the usage statistics of traffic analysis tools for websitesThis report shows the historical trends in the usage of the top traffic analysis tools since October 2022. | 2022
1 Oct | 2023
1 Jan | 2023
1 Apr | 2023
1 Jul | 2023
1 Oct | 2024
1 Jan | 2024
1 Apr | 2024
1 Jul | 2024
1 Oct | 2025
1 Jan | 2025
1 Apr | 2025
1 Jul | 2025
1 Oct | 2025
29 Oct | | None | 35.1% | 34.4% | 34.1% | 34.4% | 35.2% | 36.0% | 37.0% | 38.5% | 40.1% | 40.7% | 41.9% | 42.8% | 42.8% | 43.1% |
|---|
| Google Analytics | 55.7% | 56.5% | 56.8% | 56.3% | 55.0% | 53.9% | 52.7% | 51.3% | 49.6% | 48.7% | 47.5% | 46.5% | 45.6% | 45.3% |
|---|
| Meta Pixel | 11.0% | 11.1% | 11.1% | 11.2% | 11.2% | 11.2% | 11.1% | 10.8% | 10.3% | 10.2% | 9.8% | 9.7% | 9.5% | 9.4% |
|---|
| WordPress Jetpack | 5.1% | 5.0% | 5.0% | 5.2% | 6.1% | 6.2% | 6.3% | 5.6% | 4.8% | 4.6% | 4.5% | 4.3% | 4.1% | 4.1% |
|---|
| Yandex.Metrica | 5.3% | 5.1% | 4.9% | 4.7% | 4.5% | 4.4% | 4.2% | 4.0% | 3.9% | 3.9% | 3.8% | 3.8% | 3.7% | 3.7% |
|---|
| Microsoft Clarity | | | | | | | | | | | | | 3.3% | 3.4% |
|---|
| Hotjar | 3.5% | 3.4% | 3.3% | 3.2% | 3.2% | 3.1% | 3.0% | 2.8% | 2.7% | 2.6% | 2.5% | 2.3% | 2.2% | 2.2% |
|---|
| MonsterInsights | 2.8% | 2.9% | 2.9% | 2.9% | 2.2% | 2.2% | 2.2% | 2.2% | 2.2% | 2.1% | 2.1% | 2.0% | 1.9% | 1.8% |
|---|
| Matomo | 1.2% | 1.4% | 1.5% | 1.5% | 1.6% | 1.7% | 1.7% | 1.7% | 1.6% | 1.6% | 1.6% | 1.6% | 1.6% | 1.6% |
|---|
| Microsoft UET | 1.8% | 1.7% | 1.6% | 1.6% | 1.7% | 1.6% | 1.6% | 1.5% | 1.4% | 1.4% | 1.4% | 1.3% | 1.3% | 1.3% |
|---|
| Snowplow | 0.8% | 0.8% | 0.9% | 0.9% | 0.9% | 0.9% | 1.0% | 1.0% | 1.1% | 1.1% | 1.2% | 1.2% | 1.2% | 1.2% |
|---|
| Cloudflare Web Analytics | 1.2% | 1.1% | 1.1% | 1.1% | 1.2% | 1.2% | 1.0% | 0.6% | 0.6% | 0.7% | 0.8% | 0.9% | 0.9% | 1.0% |
|---|
| New Relic | 1.3% | 1.3% | 1.3% | 1.3% | 1.3% | 1.2% | 1.2% | 1.1% | 1.0% | 0.9% | 0.8% | 0.8% | 0.8% | 0.8% |
|---|
The diagram shows only traffic analysis tools with more than 1% usage.
 | Find more details in our extensive traffic analysis tools market reports. Learn more
|
Share this page |  LinkedIn
 Mastodon
 Bluesky