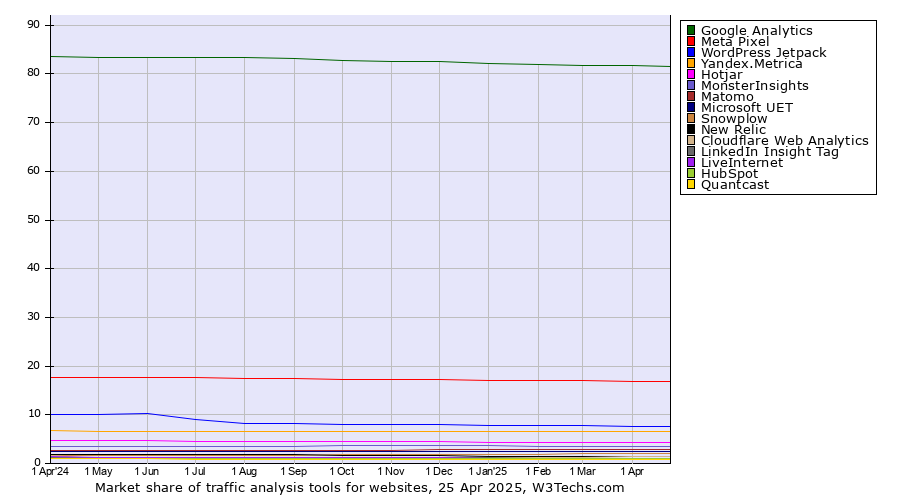
Technologies > Traffic Analysis Tools > Market Share Trend > Monthly Market share trends for traffic analysis toolsThis report shows the market share trends for the top traffic analysis tools since July 2025. | 2025
1 Jul | 2025
1 Aug | 2025
1 Sep | 2025
1 Oct | 2025
1 Nov | 2025
1 Dec | 2026
1 Jan | 2026
1 Feb | 2026
1 Mar | 2026
1 Apr | 2026
1 May | 2026
1 Jun | 2026
1 Jul | 2026
19 Jul | | Google Analytics | 81.3% | 80.1% | 79.9% | 79.8% | 79.6% | 79.3% | 79.0% | 78.9% | 78.7% | 78.6% | 78.4% | 79.2% | 82.0% | 83.3% |
|---|
| Meta Pixel | 16.9% | 16.7% | 16.6% | 16.6% | 16.5% | 16.5% | 16.4% | 16.4% | 16.3% | 16.3% | 16.3% | 16.1% | 15.5% | 15.2% |
|---|
| Microsoft Clarity | | 5.3% | 5.5% | 5.8% | 6.0% | 6.1% | 6.2% | 6.3% | 6.5% | 6.7% | 6.8% | 6.9% | 6.8% | 6.8% |
|---|
| Yandex.Metrica | 6.6% | 6.5% | 6.5% | 6.5% | 6.5% | 6.5% | 6.5% | 6.6% | 6.6% | 6.6% | 6.6% | 6.5% | 6.3% | 6.2% |
|---|
| WordPress Jetpack | 7.5% | 7.4% | 7.3% | 7.2% | 7.2% | 7.1% | 7.1% | 7.0% | 6.9% | 6.8% | 6.7% | 6.6% | 6.3% | 6.1% |
|---|
| Hotjar | 4.1% | 4.0% | 4.0% | 3.9% | 3.9% | 3.8% | 3.8% | 3.7% | 3.7% | 3.6% | 3.6% | 3.5% | 3.3% | 3.2% |
|---|
| Cloudflare Web Analytics | 1.5% | 1.6% | 1.6% | 1.7% | 1.8% | 2.3% | 2.7% | 2.8% | 2.6% | 2.6% | 2.8% | 2.9% | 2.8% | 2.8% |
|---|
| MonsterInsights | 3.4% | 3.4% | 3.3% | 3.3% | 3.2% | 3.2% | 3.1% | 3.1% | 3.0% | 3.0% | 2.9% | 2.8% | 2.7% | 2.6% |
|---|
| Matomo | 2.8% | 2.8% | 2.7% | 2.7% | 2.7% | 2.7% | 2.7% | 2.7% | 2.7% | 2.7% | 2.7% | 2.6% | 2.5% | 2.5% |
|---|
| Snowplow | 2.1% | 2.1% | 2.2% | 2.2% | 2.2% | 2.2% | 2.2% | 2.2% | 2.2% | 2.3% | 2.3% | 2.3% | 2.2% | 2.2% |
|---|
| Microsoft UET | 2.3% | 2.3% | 2.3% | 2.3% | 2.3% | 2.3% | 2.2% | 2.2% | 2.2% | 2.2% | 2.2% | 2.2% | 2.1% | 2.1% |
|---|
| TikTok Pixel | 1.0% | 1.0% | 1.0% | 1.1% | 1.1% | 1.1% | 1.2% | 1.2% | 1.2% | 1.2% | 1.3% | 1.3% | 1.2% | 1.2% |
|---|
The diagram shows only traffic analysis tools with more than 1% market share.
 | Find more details in our extensive traffic analysis tools market reports. Learn more
|
Share this page | 

 LinkedIn
 Mastodon
 Bluesky