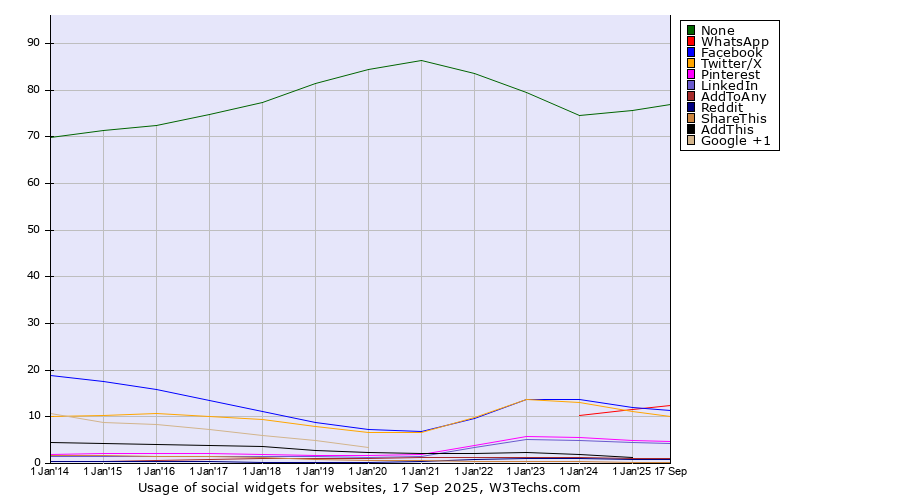
Technologies > Social Widgets > Usage Trend > Yearly Historical yearly trends in the usage statistics of social widgets for websitesThis report shows the historical trends in the usage of the top social widgets since January 2014. | 2014
1 Jan | 2015
1 Jan | 2016
1 Jan | 2017
1 Jan | 2018
1 Jan | 2019
1 Jan | 2020
1 Jan | 2021
1 Jan | 2022
1 Jan | 2023
1 Jan | 2024
1 Jan | 2025
1 Jan | 2025
16 Sep | | None | 69.9% | 71.3% | 72.5% | 74.8% | 77.3% | 81.4% | 84.4% | 86.4% | 83.7% | 79.5% | 74.5% | 75.7% | 76.8% |
|---|
| WhatsApp | | | | | | | | | | | 10.3% | 11.5% | 12.5% |
|---|
| Facebook | 18.9% | 17.5% | 15.8% | 13.4% | 11.2% | 8.8% | 7.3% | 6.8% | 9.7% | 13.8% | 13.6% | 12.1% | 11.3% |
|---|
| Twitter/X | 10.0% | 10.3% | 10.7% | 10.2% | 9.4% | 8.0% | 6.7% | 6.5% | 9.8% | 13.6% | 13.1% | 11.2% | 10.1% |
|---|
| Pinterest | 1.9% | 2.1% | 2.2% | 2.2% | 2.0% | 1.8% | 1.7% | 2.0% | 3.8% | 5.7% | 5.5% | 4.9% | 4.6% |
|---|
| LinkedIn | 1.5% | 1.4% | 1.5% | 1.5% | 1.4% | 1.4% | 1.3% | 1.6% | 3.4% | 5.1% | 5.0% | 4.5% | 4.3% |
|---|
| AddToAny | 0.4% | 0.5% | 0.7% | 0.8% | 1.0% | 1.1% | 1.2% | 1.3% | 1.3% | 1.3% | 1.2% | 1.1% | 1.0% |
|---|
| Reddit | 0.5% | 0.4% | 0.4% | 0.3% | 0.3% | 0.3% | 0.3% | 0.3% | 0.8% | 1.1% | 1.0% | 0.8% | 0.8% |
|---|
| Tumblr | 0.3% | 0.3% | 0.3% | 0.2% | 0.2% | 0.2% | 0.2% | 0.2% | 0.5% | 0.8% | 0.8% | 0.6% | 0.6% |
|---|
| VKontakte | 0.3% | 0.2% | 0.2% | 0.4% | 0.3% | 0.3% | 0.3% | 0.3% | 0.5% | 0.7% | 0.7% | 0.5% | 0.5% |
|---|
| Telegram | | | | | | | | | | | 0.3% | 0.3% | 0.3% |
|---|
| ShareThis | 1.8% | 1.6% | 1.5% | 1.5% | 1.2% | 0.9% | 0.7% | 0.5% | 0.5% | 0.4% | 0.4% | 0.2% | 0.2% |
|---|
| Line | | | | | | | | | | | | 0.1% | 0.1% |
|---|
The diagram shows only social widgets with more than 1% usage.
 | Find more details in our extensive social widgets market reports. Learn more
|
Share this page |  LinkedIn
 Mastodon
 Bluesky