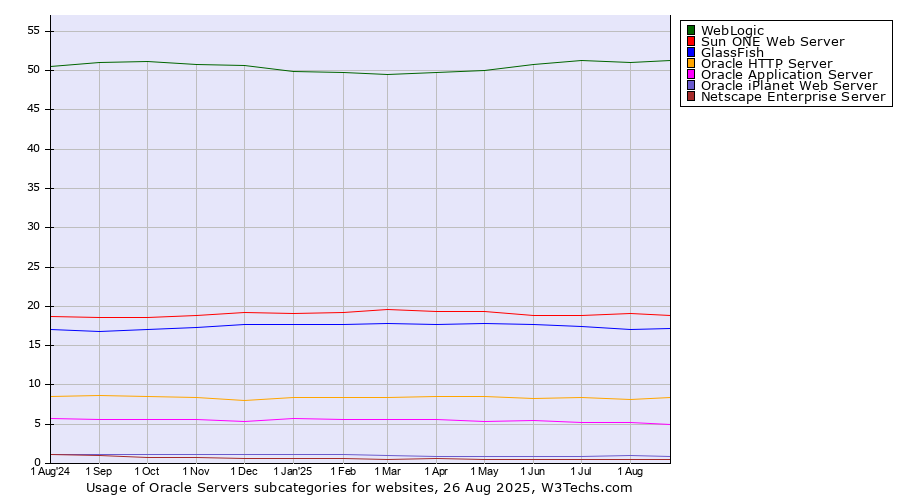
Technologies > Web Servers > Oracle Servers > Subcategories History > Monthly Historical trends in the usage statistics of Oracle Servers subcategories for websitesThis report shows the historical trends in the usage of Oracle Servers subcategories since October 2024. | 2024
1 Oct | 2024
1 Nov | 2024
1 Dec | 2025
1 Jan | 2025
1 Feb | 2025
1 Mar | 2025
1 Apr | 2025
1 May | 2025
1 Jun | 2025
1 Jul | 2025
1 Aug | 2025
1 Sep | 2025
1 Oct | 2025
19 Oct | | WebLogic | 51.2% | 50.7% | 50.6% | 49.9% | 49.7% | 49.5% | 49.8% | 50.0% | 50.8% | 51.3% | 51.0% | 51.4% | 51.2% | 51.1% |
|---|
| Sun ONE Web Server | 18.6% | 18.8% | 19.2% | 19.1% | 19.2% | 19.5% | 19.4% | 19.4% | 18.8% | 18.8% | 19.1% | 18.7% | 19.2% | 19.2% |
|---|
| GlassFish | 17.1% | 17.3% | 17.6% | 17.6% | 17.7% | 17.8% | 17.7% | 17.8% | 17.7% | 17.4% | 17.0% | 17.3% | 17.2% | 17.6% |
|---|
| Oracle HTTP Server | 8.5% | 8.5% | 8.0% | 8.4% | 8.4% | 8.4% | 8.5% | 8.5% | 8.3% | 8.3% | 8.2% | 8.3% | 8.1% | 8.2% |
|---|
| Oracle Application Server | 5.6% | 5.5% | 5.4% | 5.7% | 5.6% | 5.7% | 5.6% | 5.3% | 5.5% | 5.3% | 5.2% | 5.0% | 5.1% | 4.9% |
|---|
| Oracle iPlanet Web Server | 1.1% | 1.2% | 1.2% | 1.1% | 1.2% | 1.0% | 0.9% | 0.9% | 0.9% | 0.9% | 1.0% | 0.9% | 0.9% | 0.8% |
|---|
| Netscape Enterprise Server | 0.8% | 0.8% | 0.6% | 0.6% | 0.6% | 0.6% | 0.6% | 0.6% | 0.6% | 0.6% | 0.6% | 0.6% | 0.6% | 0.6% |
|---|
| Sun Java System Application Server | 0.2% | 0.2% | 0.2% | 0.2% | 0.3% | 0.2% | 0.2% | 0.2% | 0.3% | 0.3% | 0.3% | 0.6% | 0.6% | 0.5% |
|---|
| Sun Java System Web Server | 0.1% | 0.1% | 0.1% | 0.1% | 0.1% | 0.1% | 0.1% | 0.2% | 0.2% | 0.2% | 0.2% | 0.2% | 0.2% | 0.2% |
|---|
The diagram shows only Oracle Servers subcategories with more than 1% usage.
 | Find more details in our extensive Oracle Servers market report. Learn more
|
Share this page |  LinkedIn
 Mastodon
 Bluesky