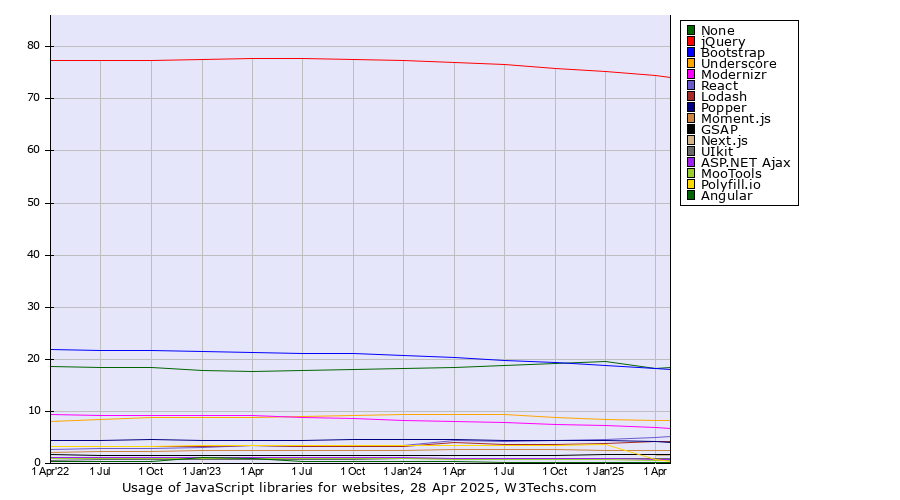
Technologies > JavaScript Libraries > Usage Trend > Quarterly Historical quarterly trends in the usage statistics of javascript libraries for websitesThis report shows the historical trends in the usage of the top JavaScript libraries since July 2022. | 2022
1 Jul | 2022
1 Oct | 2023
1 Jan | 2023
1 Apr | 2023
1 Jul | 2023
1 Oct | 2024
1 Jan | 2024
1 Apr | 2024
1 Jul | 2024
1 Oct | 2025
1 Jan | 2025
1 Apr | 2025
1 Jul | 2025
7 Sep | | None | 18.4% | 18.4% | 17.9% | 17.7% | 17.8% | 18.0% | 18.1% | 18.4% | 18.8% | 19.2% | 19.5% | 18.2% | 18.7% | 19.0% |
|---|
| jQuery | 77.4% | 77.4% | 77.6% | 77.7% | 77.7% | 77.5% | 77.3% | 77.0% | 76.5% | 75.9% | 75.3% | 74.4% | 73.5% | 72.8% |
|---|
| Bootstrap | 21.7% | 21.7% | 21.5% | 21.3% | 21.2% | 21.1% | 20.8% | 20.4% | 19.9% | 19.3% | 18.9% | 18.2% | 17.7% | 17.4% |
|---|
| Underscore | 8.5% | 8.9% | 8.8% | 8.9% | 9.1% | 9.3% | 9.3% | 9.5% | 9.5% | 8.9% | 8.5% | 8.2% | 8.2% | 8.1% |
|---|
| Modernizr | 9.2% | 9.1% | 9.2% | 9.1% | 8.9% | 8.6% | 8.3% | 8.1% | 7.8% | 7.5% | 7.2% | 6.9% | 6.6% | 6.4% |
|---|
| React | 2.9% | 3.0% | 3.2% | 3.4% | 3.4% | 3.4% | 3.5% | 4.5% | 4.2% | 4.3% | 4.7% | 5.0% | 5.6% | 5.9% |
|---|
| Lodash | 3.3% | 3.3% | 3.3% | 3.4% | 3.3% | 3.3% | 3.3% | 4.1% | 3.6% | 3.7% | 3.9% | 4.2% | 4.4% | 4.6% |
|---|
| Popper | 4.5% | 4.5% | 4.4% | 4.4% | 4.5% | 4.5% | 4.5% | 4.5% | 4.5% | 4.4% | 4.3% | 4.1% | 4.0% | 3.9% |
|---|
| Moment.js | 2.3% | 2.4% | 2.5% | 2.5% | 2.5% | 2.6% | 2.6% | 2.6% | 2.6% | 2.6% | 2.5% | 2.4% | 2.6% | 2.6% |
|---|
| GSAP | 1.6% | 1.6% | 1.6% | 1.6% | 1.6% | 1.6% | 1.6% | 1.6% | 1.6% | 1.6% | 1.7% | 1.7% | 1.9% | 1.9% |
|---|
| Next.js | | | | | | | | | | | | 1.5% | 1.6% | 1.8% |
|---|
| UIkit | 0.7% | 0.7% | 0.8% | 0.8% | 0.8% | 0.9% | 0.9% | 0.9% | 1.0% | 1.0% | 1.0% | 1.0% | 1.0% | 1.0% |
|---|
| Backbone | 0.8% | 0.9% | 0.9% | 0.9% | 0.9% | 0.9% | 0.9% | 0.9% | 0.9% | 0.8% | 0.8% | 0.8% | 0.8% | 0.8% |
|---|
The diagram shows only JavaScript libraries with more than 1% usage.
 | Find more details in our extensive JavaScript libraries market reports. Learn more
|
Share this page |  LinkedIn
 Mastodon
 Bluesky