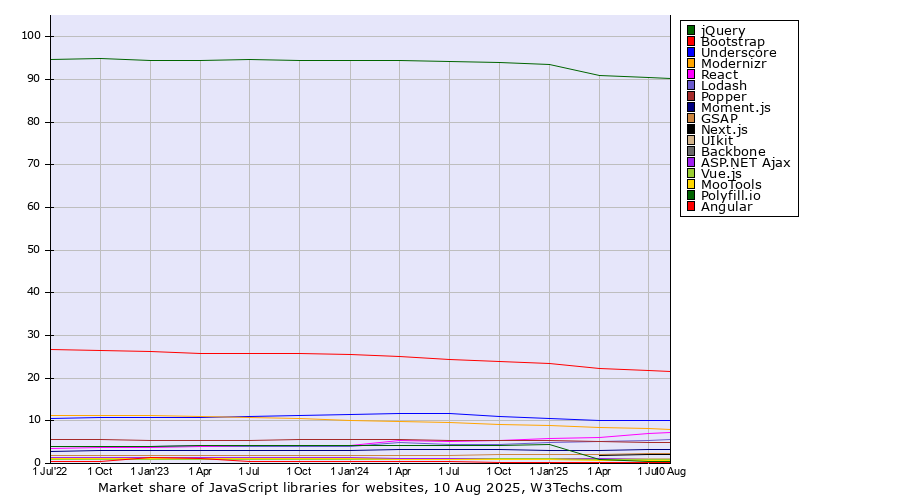
Technologies > JavaScript Libraries > Market Share Trend > Quarterly Market share quarterly trends for JavaScript librariesThis report shows the market share trends for the top JavaScript libraries since July 2023. | 2023
1 Jul | 2023
1 Oct | 2024
1 Jan | 2024
1 Apr | 2024
1 Jul | 2024
1 Oct | 2025
1 Jan | 2025
1 Apr | 2025
1 Jul | 2025
1 Oct | 2026
1 Jan | 2026
1 Apr | 2026
1 Jul | 2026
26 Jul | | jQuery | 94.6% | 94.5% | 94.5% | 94.4% | 94.3% | 94.0% | 93.6% | 91.0% | 90.4% | 89.7% | 89.0% | 88.3% | 87.3% | 86.9% |
|---|
| Bootstrap | 25.8% | 25.7% | 25.4% | 25.0% | 24.5% | 24.0% | 23.5% | 22.3% | 21.8% | 21.3% | 20.8% | 20.4% | 19.9% | 19.8% |
|---|
| Underscore | 11.1% | 11.3% | 11.4% | 11.6% | 11.7% | 11.0% | 10.6% | 10.1% | 10.1% | 10.0% | 9.8% | 9.6% | 9.4% | 9.3% |
|---|
| React | 4.1% | 4.2% | 4.3% | 5.5% | 5.1% | 5.4% | 5.8% | 6.2% | 6.9% | 7.4% | 7.7% | 7.9% | 7.8% | 7.8% |
|---|
| Modernizr | 10.8% | 10.5% | 10.2% | 9.9% | 9.6% | 9.2% | 9.0% | 8.4% | 8.1% | 7.8% | 7.5% | 7.2% | 6.9% | 6.8% |
|---|
| Lodash | 4.0% | 4.0% | 4.0% | 5.0% | 4.5% | 4.5% | 4.9% | 5.1% | 5.5% | 5.8% | 6.0% | 6.2% | 6.3% | 6.3% |
|---|
| Popper | 5.5% | 5.5% | 5.6% | 5.5% | 5.5% | 5.5% | 5.4% | 5.1% | 4.9% | 4.8% | 4.7% | 4.7% | 4.5% | 4.5% |
|---|
| Next.js | | | | | | | | 1.9% | 2.0% | 2.3% | 2.6% | 3.0% | 3.7% | 3.9% |
|---|
| Moment.js | 3.1% | 3.1% | 3.1% | 3.2% | 3.2% | 3.2% | 3.1% | 3.0% | 3.2% | 3.2% | 3.2% | 3.2% | 3.1% | 3.2% |
|---|
| GSAP | 2.0% | 2.0% | 2.0% | 2.0% | 2.0% | 2.0% | 2.1% | 2.1% | 2.3% | 2.4% | 2.5% | 2.7% | 2.8% | 2.8% |
|---|
| UIkit | 1.0% | 1.0% | 1.1% | 1.1% | 1.2% | 1.2% | 1.3% | 1.2% | 1.3% | 1.3% | 1.3% | 1.3% | 1.2% | 1.2% |
|---|
| Nuxt | | | | | | | | 0.6% | 0.7% | 0.8% | 0.8% | 0.9% | 1.0% | 1.0% |
|---|
The diagram shows only JavaScript libraries with more than 1% market share.
 | Find more details in our extensive JavaScript libraries market reports. Learn more
|
Share this page | 

 LinkedIn
 Mastodon
 Bluesky