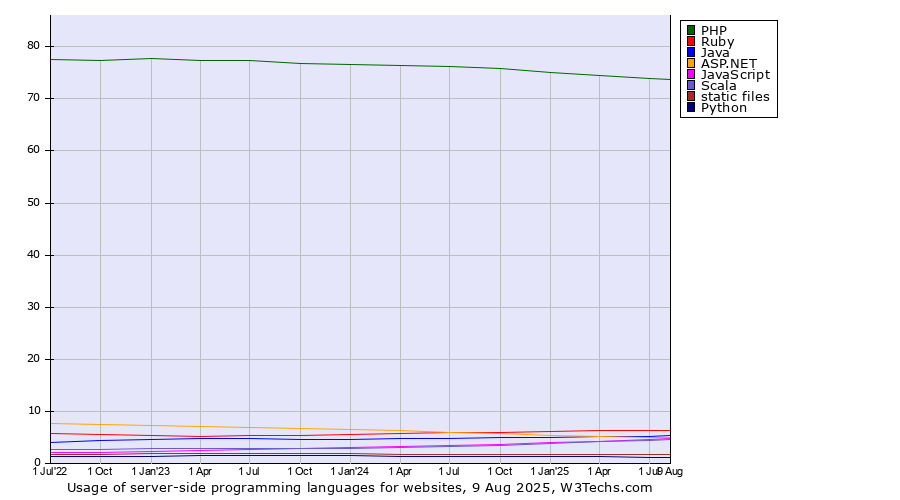
Technologies > Server-side Languages > Historical Trend > Quarterly Historical quarterly trends in the usage statistics of server-side programming languages for websitesThis report shows the historical trends in the usage of the top server-side programming languages since July 2023. | 2023
1 Jul | 2023
1 Oct | 2024
1 Jan | 2024
1 Apr | 2024
1 Jul | 2024
1 Oct | 2025
1 Jan | 2025
1 Apr | 2025
1 Jul | 2025
1 Oct | 2026
1 Jan | 2026
1 Apr | 2026
1 Jul | 2026
17 Jul | | PHP | 77.4% | 76.8% | 76.7% | 76.4% | 76.2% | 75.8% | 75.2% | 74.5% | 74.0% | 73.4% | 72.4% | 71.7% | 70.8% | 70.6% |
|---|
| Ruby | 5.4% | 5.5% | 5.6% | 5.8% | 5.9% | 6.0% | 6.2% | 6.2% | 6.3% | 6.4% | 6.5% | 6.7% | 6.8% | 6.9% |
|---|
| JavaScript | 2.6% | 3.0% | 3.1% | 3.3% | 3.4% | 3.6% | 4.0% | 4.3% | 4.6% | 5.0% | 5.4% | 5.9% | 6.7% | 6.9% |
|---|
| Java | 4.7% | 4.7% | 4.7% | 4.8% | 4.9% | 5.0% | 5.0% | 5.1% | 5.2% | 5.3% | 5.4% | 5.4% | 5.5% | 5.4% |
|---|
| Scala | 2.9% | 2.9% | 3.0% | 3.0% | 3.2% | 3.5% | 3.8% | 4.2% | 4.5% | 4.7% | 4.8% | 5.0% | 5.0% | 5.0% |
|---|
| ASP.NET | 7.0% | 6.8% | 6.6% | 6.3% | 6.0% | 5.7% | 5.4% | 5.2% | 5.0% | 4.8% | 4.6% | 4.4% | 4.3% | 4.3% |
|---|
| static files | 1.9% | 1.9% | 1.8% | 1.8% | 1.8% | 1.7% | 1.7% | 1.7% | 1.7% | 1.7% | 2.1% | 2.1% | 2.1% | 2.1% |
|---|
| Python | 1.5% | 1.4% | 1.4% | 1.4% | 1.4% | 1.3% | 1.3% | 1.3% | 1.2% | 1.2% | 1.2% | 1.2% | 1.2% | 1.2% |
|---|
| ColdFusion | 0.3% | 0.3% | 0.3% | 0.3% | 0.2% | 0.2% | 0.2% | 0.2% | 0.2% | 0.2% | 0.2% | 0.2% | 0.2% | 0.2% |
|---|
| Perl | 0.2% | 0.2% | 0.1% | 0.1% | 0.1% | 0.1% | 0.1% | 0.1% | 0.1% | 0.1% | 0.1% | 0.1% | 0.1% | 0.1% |
|---|
| Erlang | 0.1% | 0.1% | 0.1% | 0.1% | 0.1% | 0.1% | 0.1% | 0.1% | <0.1% | <0.1% | <0.1% | <0.1% | <0.1% | <0.1% |
|---|
The diagram shows only server-side programming languages with more than 1% usage.
 | Find more details in our extensive server-side programming languages market reports. Learn more
|
Share this page | 

 LinkedIn
 Mastodon
 Bluesky