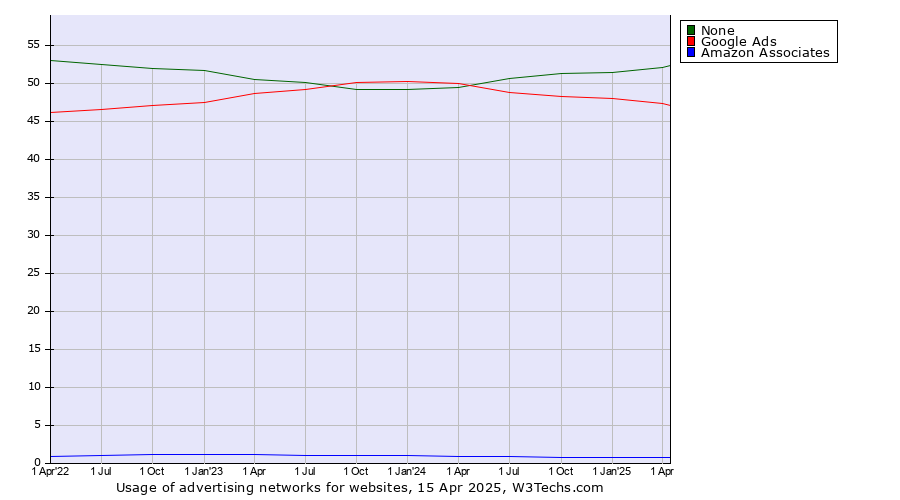
Technologies > Advertising Networks > Usage Trend > Quarterly Historical quarterly trends in the usage statistics of advertising networks for websitesThis report shows the historical trends in the usage of the top advertising networks since October 2023. | 2023
1 Oct | 2024
1 Jan | 2024
1 Apr | 2024
1 Jul | 2024
1 Oct | 2025
1 Jan | 2025
1 Apr | 2025
1 Jul | 2025
1 Oct | 2026
1 Jan | 2026
1 Apr | 2026
1 Jul | 2026
1 Oct | 2026
11 Oct | | None | 49.3% | 49.2% | 49.5% | 50.7% | 51.3% | 51.5% | 52.2% | 52.6% | 53.3% | 54.5% | 54.0% | 54.6% | 56.4% | 56.2% |
|---|
| Google Ads | 50.1% | 50.3% | 50.0% | 48.8% | 48.3% | 48.1% | 47.4% | 47.0% | 46.4% | 45.1% | 45.7% | 45.0% | 43.3% | 43.5% |
|---|
| Amazon Associates | 1.1% | 1.1% | 1.0% | 0.9% | 0.8% | 0.8% | 0.8% | 0.8% | 0.8% | 0.7% | 0.7% | 0.6% | 0.6% | 0.6% |
|---|
| AdRoll | 0.4% | 0.3% | 0.3% | 0.3% | 0.3% | 0.3% | 0.3% | 0.2% | 0.2% | 0.3% | 0.3% | 0.3% | 0.3% | 0.3% |
|---|
| Microsoft Advertising | 0.4% | 0.3% | 0.3% | 0.3% | 0.2% | 0.2% | 0.2% | 0.2% | 0.2% | 0.2% | 0.2% | 0.1% | 0.1% | 0.1% |
|---|
| Awin | 0.1% | 0.1% | 0.1% | 0.1% | 0.1% | 0.1% | 0.1% | 0.1% | 0.1% | 0.1% | 0.1% | 0.1% | 0.1% | 0.1% |
|---|
| CJ Affiliate | 0.1% | 0.1% | 0.1% | 0.1% | 0.1% | 0.1% | 0.1% | 0.1% | 0.1% | 0.1% | 0.1% | 0.1% | 0.1% | 0.1% |
|---|
| MGID | 0.1% | 0.1% | 0.1% | 0.1% | 0.1% | 0.1% | 0.1% | 0.1% | 0.1% | 0.1% | 0.1% | 0.1% | 0.1% | 0.1% |
|---|
| ValueCommerce | 0.1% | 0.1% | 0.1% | 0.1% | 0.1% | 0.1% | 0.1% | 0.1% | 0.1% | 0.1% | <0.1% | <0.1% | <0.1% | <0.1% |
|---|
| OpenX | 0.3% | 0.2% | 0.2% | 0.2% | 0.2% | 0.2% | 0.1% | 0.1% | 0.1% | 0.1% | <0.1% | <0.1% | <0.1% | <0.1% |
|---|
| Equativ | 0.2% | 0.2% | 0.1% | 0.1% | 0.1% | 0.3% | 0.4% | 0.4% | 0.3% | 0.3% | 0.3% | <0.1% | <0.1% | <0.1% |
|---|
| Yandex.Direct | 0.1% | 0.1% | 0.1% | 0.1% | 0.1% | 0.1% | 0.1% | 0.1% | 0.1% | 0.1% | <0.1% | <0.1% | <0.1% | <0.1% |
|---|
| Rakuten Advertising | 0.1% | 0.1% | 0.1% | 0.1% | <0.1% | <0.1% | <0.1% | <0.1% | <0.1% | <0.1% | <0.1% | <0.1% | <0.1% | <0.1% |
|---|
The diagram shows only advertising networks with more than 1% usage.
 | Find more details in our extensive advertising networks market reports. Learn more
|
Share this page | 


 LinkedIn
 Mastodon
 Bluesky