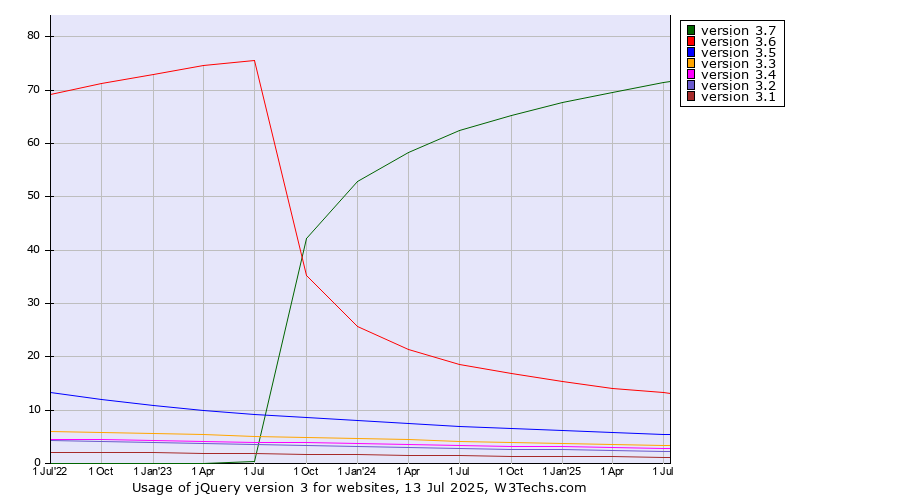
Technologies > JavaScript Libraries > jQuery > Version 3 > Version History > Quarterly Historical quarterly trends in the usage statistics of jQuery version 3 for websitesThis report shows the historical trends in the usage of subversions of jQuery Version 3 since October 2022. | 2022
1 Oct | 2023
1 Jan | 2023
1 Apr | 2023
1 Jul | 2023
1 Oct | 2024
1 Jan | 2024
1 Apr | 2024
1 Jul | 2024
1 Oct | 2025
1 Jan | 2025
1 Apr | 2025
1 Jul | 2025
1 Oct | 2025
21 Oct | | version 3.7 | <0.1% | <0.1% | <0.1% | 0.4% | 42.1% | 52.8% | 58.2% | 62.4% | 65.2% | 67.6% | 69.6% | 71.4% | 72.9% | 73.2% |
|---|
| version 3.6 | 71.2% | 73.0% | 74.6% | 75.6% | 35.2% | 25.7% | 21.4% | 18.5% | 16.8% | 15.3% | 14.2% | 13.3% | 12.4% | 12.3% |
|---|
| version 3.5 | 12.0% | 10.9% | 10.0% | 9.2% | 8.6% | 8.0% | 7.5% | 6.9% | 6.5% | 6.2% | 5.8% | 5.5% | 5.2% | 5.2% |
|---|
| version 3.3 | 5.8% | 5.6% | 5.4% | 5.1% | 4.9% | 4.7% | 4.4% | 4.2% | 3.9% | 3.7% | 3.5% | 3.3% | 3.2% | 3.1% |
|---|
| version 3.4 | 4.4% | 4.2% | 4.1% | 4.0% | 3.9% | 3.8% | 3.6% | 3.4% | 3.2% | 3.1% | 3.0% | 2.9% | 2.8% | 2.7% |
|---|
| version 3.2 | 4.2% | 4.0% | 3.8% | 3.5% | 3.3% | 3.2% | 3.0% | 2.8% | 2.7% | 2.6% | 2.4% | 2.3% | 2.2% | 2.1% |
|---|
| version 3.1 | 2.1% | 2.0% | 1.9% | 1.8% | 1.7% | 1.6% | 1.5% | 1.5% | 1.4% | 1.3% | 1.2% | 1.2% | 1.1% | 1.1% |
|---|
| version 3.0 | 0.4% | 0.4% | 0.4% | 0.3% | 0.3% | 0.3% | 0.3% | 0.3% | 0.3% | 0.2% | 0.2% | 0.2% | 0.2% | 0.2% |
|---|
The diagram shows only jQuery versions with more than 1% usage.
 | Find more details in our extensive jQuery market report. Learn more
|
Share this page |  LinkedIn
 Mastodon
 Bluesky