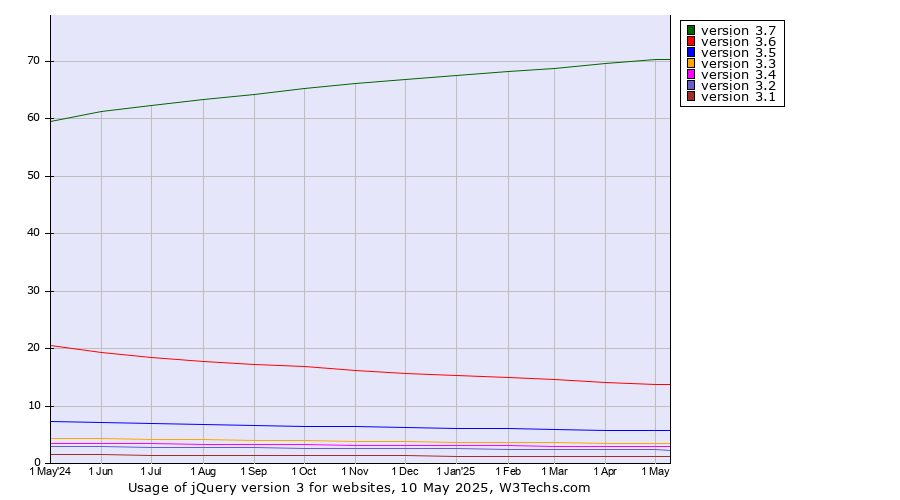
Technologies > JavaScript Libraries > jQuery > Version 3 > Version History > Monthly Historical trends in the usage statistics of jQuery version 3 for websitesThis report shows the historical trends in the usage of subversions of jQuery Version 3 since May 2025. | 2025
1 May | 2025
1 Jun | 2025
1 Jul | 2025
1 Aug | 2025
1 Sep | 2025
1 Oct | 2025
1 Nov | 2025
1 Dec | 2026
1 Jan | 2026
1 Feb | 2026
1 Mar | 2026
1 Apr | 2026
1 May | 2026
6 May | | version 3.7 | 70.3% | 70.8% | 71.4% | 72.0% | 72.5% | 72.9% | 73.3% | 73.8% | 74.2% | 74.5% | 74.8% | 75.2% | 75.6% | 75.6% |
|---|
| version 3.6 | 13.8% | 13.5% | 13.3% | 12.9% | 12.7% | 12.4% | 12.2% | 12.0% | 11.8% | 11.6% | 11.4% | 11.3% | 11.0% | 11.0% |
|---|
| version 3.5 | 5.7% | 5.6% | 5.5% | 5.4% | 5.3% | 5.2% | 5.2% | 5.1% | 5.0% | 4.9% | 4.9% | 4.8% | 4.7% | 4.7% |
|---|
| version 3.3 | 3.5% | 3.4% | 3.3% | 3.3% | 3.2% | 3.2% | 3.1% | 3.1% | 3.0% | 3.0% | 3.0% | 2.9% | 2.9% | 2.9% |
|---|
| version 3.4 | 3.0% | 2.9% | 2.9% | 2.8% | 2.8% | 2.8% | 2.7% | 2.7% | 2.7% | 2.6% | 2.6% | 2.6% | 2.5% | 2.5% |
|---|
| version 3.2 | 2.4% | 2.3% | 2.3% | 2.2% | 2.2% | 2.2% | 2.1% | 2.1% | 2.1% | 2.0% | 2.0% | 2.0% | 2.0% | 2.0% |
|---|
| version 3.1 | 1.2% | 1.2% | 1.2% | 1.2% | 1.1% | 1.1% | 1.1% | 1.1% | 1.1% | 1.1% | 1.0% | 1.0% | 1.0% | 1.0% |
|---|
| version 3.0 | 0.2% | 0.2% | 0.2% | 0.2% | 0.2% | 0.2% | 0.2% | 0.2% | 0.2% | 0.2% | 0.2% | 0.2% | 0.2% | 0.2% |
|---|
The diagram shows only jQuery versions with more than 1% usage.
 | Find more details in our extensive jQuery market report. Learn more
|
Share this page | 
 LinkedIn
 Mastodon
 Bluesky