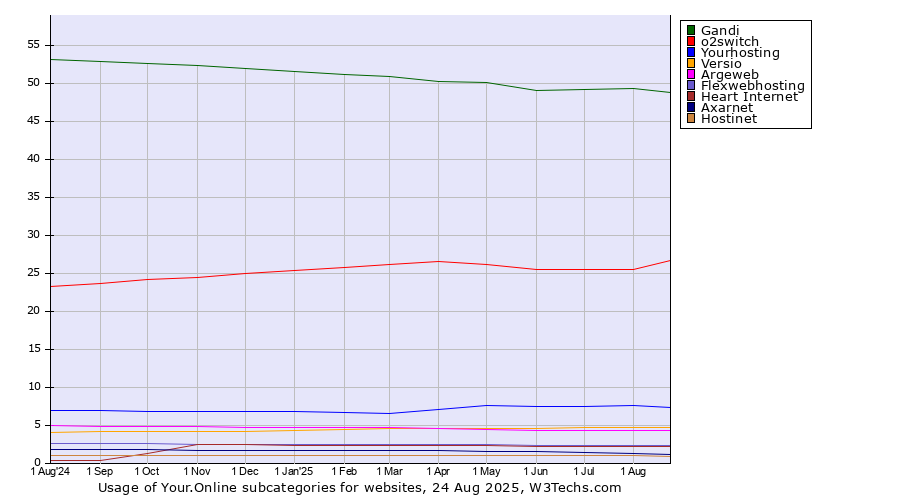
Technologies > DNS Servers > Your.Online > Subentities History > Monthly Historical trends in the usage statistics of Your.Online subentities for websitesThis report shows the historical trends in the usage of Your.Online subentities since May 2025. | 2025
1 May | 2025
1 Jun | 2025
1 Jul | 2025
1 Aug | 2025
1 Sep | 2025
1 Oct | 2025
1 Nov | 2025
1 Dec | 2026
1 Jan | 2026
1 Feb | 2026
1 Mar | 2026
1 Apr | 2026
1 May | 2026
28 May | | Gandi | 50.2% | 49.1% | 49.2% | 49.4% | 48.9% | 45.5% | 45.4% | 41.7% | 41.6% | 40.6% | 40.2% | 40.0% | 39.0% | 38.8% |
|---|
| o2switch | 26.2% | 25.5% | 25.5% | 25.6% | 26.8% | 25.6% | 26.4% | 23.4% | 23.4% | 23.4% | 24.1% | 24.5% | 26.0% | 26.7% |
|---|
| Yourhosting | 7.7% | 7.5% | 7.5% | 7.6% | 7.3% | 6.7% | 6.2% | 5.5% | 5.6% | 7.3% | 7.3% | 7.2% | 7.1% | 6.9% |
|---|
| Loading | | | | | | | | 4.4% | 4.4% | 4.3% | 4.3% | 4.3% | 4.2% | 4.2% |
|---|
| Versio | 4.6% | 4.6% | 4.7% | 4.8% | 4.8% | 4.5% | 4.6% | 4.3% | 4.3% | 4.2% | 4.2% | 4.1% | 4.0% | 3.9% |
|---|
| Pair Networks | 4.7% | 4.6% | 4.5% | 4.5% | 4.4% | 4.1% | 4.0% | 3.7% | 3.7% | 3.6% | 3.5% | 3.5% | 3.4% | 3.3% |
|---|
| Argeweb | 4.5% | 4.4% | 4.4% | 4.4% | 4.3% | 4.0% | 3.9% | 3.6% | 3.6% | 3.5% | 3.4% | 3.4% | 3.3% | 3.3% |
|---|
| 1blu | | | | | | 2.2% | 2.2% | 2.1% | 2.1% | 2.1% | 2.1% | 2.1% | 2.0% | 2.0% |
|---|
| Heart Internet | 2.3% | 2.3% | 2.3% | 2.3% | 2.3% | 2.1% | 2.1% | 1.9% | 1.9% | 1.9% | 1.9% | 1.9% | 1.8% | 1.8% |
|---|
| Flexwebhosting | 2.5% | 2.4% | 2.4% | 2.4% | 2.3% | 2.2% | 2.2% | 2.0% | 2.0% | 1.9% | 1.9% | 1.9% | 1.8% | 1.8% |
|---|
| Inleed | | | | | | | | 1.7% | 1.7% | 1.7% | 1.7% | 1.7% | 1.7% | 1.7% |
|---|
| Manitu | | | | | | | | 1.2% | 1.3% | 1.3% | 1.3% | 1.3% | 1.3% | 1.3% |
|---|
The diagram shows only Your.Online subentities with more than 1% usage.
 | Find more details in our extensive Your.Online market report. Learn more
|
Share this page | 
 LinkedIn
 Mastodon
 Bluesky