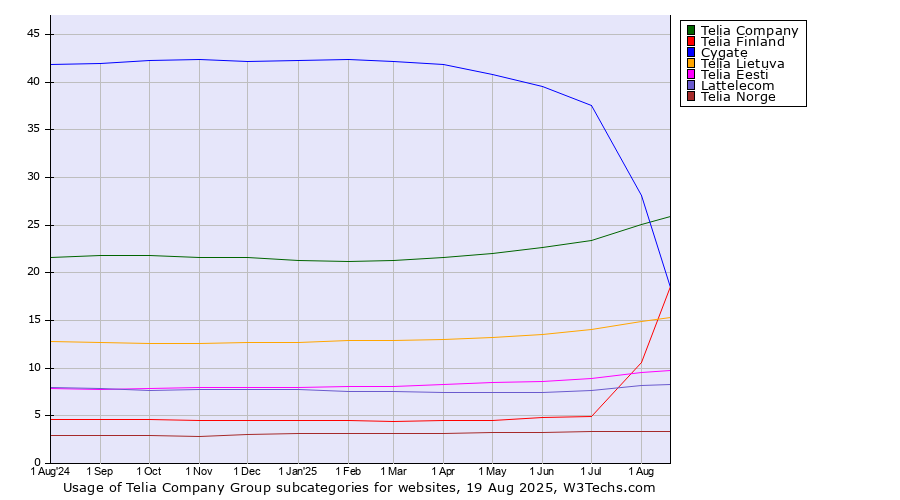
Technologies > Data Centers > Telia Company Group > Subcategories History > Monthly Historical trends in the usage statistics of Telia Company Group subcategories for websitesThis report shows the historical trends in the usage of Telia Company Group subcategories since September 2024. | 2024
1 Sep | 2024
1 Oct | 2024
1 Nov | 2024
1 Dec | 2025
1 Jan | 2025
1 Feb | 2025
1 Mar | 2025
1 Apr | 2025
1 May | 2025
1 Jun | 2025
1 Jul | 2025
1 Aug | 2025
1 Sep | 2025
30 Sep | | Telia Company | 21.8% | 21.8% | 21.6% | 21.6% | 21.3% | 21.2% | 21.3% | 21.6% | 22.1% | 22.7% | 23.4% | 25.1% | 26.3% | 26.5% |
|---|
| Telia Finland | 4.6% | 4.6% | 4.5% | 4.5% | 4.5% | 4.5% | 4.5% | 4.5% | 4.5% | 4.8% | 5.0% | 10.6% | 24.6% | 26.2% |
|---|
| Telia Lietuva | 12.7% | 12.5% | 12.6% | 12.7% | 12.7% | 12.9% | 13.0% | 13.0% | 13.2% | 13.5% | 14.0% | 14.9% | 15.6% | 15.5% |
|---|
| Cygate | 42.0% | 42.2% | 42.3% | 42.1% | 42.3% | 42.4% | 42.2% | 41.8% | 40.8% | 39.5% | 37.6% | 28.1% | 11.6% | 10.3% |
|---|
| Telia Eesti | 7.8% | 7.9% | 7.9% | 8.0% | 8.0% | 8.1% | 8.1% | 8.2% | 8.4% | 8.6% | 8.9% | 9.5% | 10.0% | 10.1% |
|---|
| Lattelecom | 7.8% | 7.7% | 7.8% | 7.7% | 7.8% | 7.6% | 7.5% | 7.4% | 7.4% | 7.4% | 7.7% | 8.2% | 8.3% | 7.8% |
|---|
| Telia Norge | 2.9% | 2.9% | 2.9% | 3.1% | 3.2% | 3.2% | 3.2% | 3.1% | 3.2% | 3.3% | 3.4% | 3.4% | 3.4% | 3.4% |
|---|
| Moldcell | 0.1% | 0.1% | 0.1% | 0.1% | 0.1% | 0.1% | 0.1% | 0.1% | 0.1% | 0.1% | 0.1% | 0.1% | 0.1% | 0.1% |
|---|
| Kcell | 0.1% | 0.1% | 0.1% | 0.1% | 0.1% | 0.1% | 0.1% | 0.1% | 0.1% | 0.1% | 0.1% | 0.1% | 0.1% | 0.1% |
|---|
| Tcell | 0.1% | 0.1% | 0.1% | 0.1% | <0.1% | <0.1% | <0.1% | <0.1% | <0.1% | <0.1% | <0.1% | <0.1% | <0.1% | <0.1% |
|---|
| Inmics-Nebula | 0.2% | 0.2% | 0.2% | 0.2% | 0.2% | 0.2% | 0.2% | 0.2% | 0.1% | | | | | |
|---|
The diagram shows only Telia Company Group subcategories with more than 1% usage.
 | Find more details in our extensive Telia Company Group market report. Learn more
|
Share this page |  LinkedIn
 Mastodon
 Bluesky