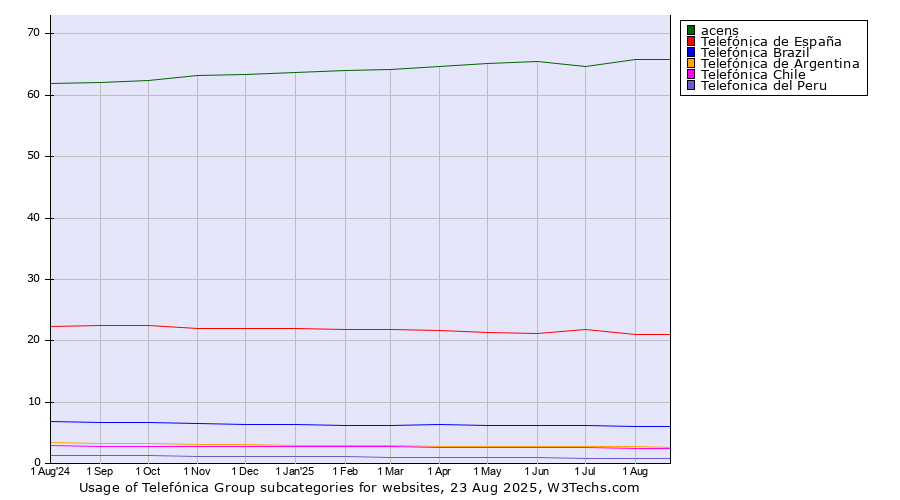
Technologies > Data Centers > Telefónica Group > Subcategories History > Monthly Historical trends in the usage statistics of Telefónica Group subcategories for websitesThis report shows the historical trends in the usage of Telefónica Group subcategories since October 2024. | 2024
1 Oct | 2024
1 Nov | 2024
1 Dec | 2025
1 Jan | 2025
1 Feb | 2025
1 Mar | 2025
1 Apr | 2025
1 May | 2025
1 Jun | 2025
1 Jul | 2025
1 Aug | 2025
1 Sep | 2025
1 Oct | 2025
29 Oct | | acens | 62.4% | 63.2% | 63.4% | 63.6% | 64.0% | 64.2% | 64.6% | 65.2% | 65.5% | 64.6% | 65.8% | 65.7% | 65.7% | 66.1% |
|---|
| Telefónica de España | 22.5% | 22.0% | 22.0% | 22.0% | 21.9% | 21.9% | 21.6% | 21.3% | 21.1% | 21.8% | 21.0% | 21.1% | 21.1% | 21.0% |
|---|
| Telefónica Brazil | 6.7% | 6.5% | 6.4% | 6.3% | 6.2% | 6.2% | 6.3% | 6.1% | 6.1% | 6.2% | 6.0% | 6.1% | 6.0% | 6.0% |
|---|
| Telefónica de Argentina | 3.2% | 3.1% | 3.1% | 3.0% | 2.9% | 2.9% | 2.8% | 2.8% | 2.7% | 2.8% | 2.7% | 2.7% | 2.7% | 2.7% |
|---|
| Telefónica Chile | 2.8% | 2.8% | 2.7% | 2.8% | 2.8% | 2.8% | 2.6% | 2.6% | 2.5% | 2.6% | 2.5% | 2.5% | 2.5% | 2.4% |
|---|
| Telefonica del Peru | 1.2% | 1.2% | 1.2% | 1.1% | 1.1% | 1.0% | 0.9% | 0.9% | 0.9% | 0.9% | 0.9% | 0.9% | 0.9% | 0.9% |
|---|
| Telefónica Deutschland | 0.5% | 0.5% | 0.5% | 0.5% | 0.6% | 0.5% | 0.6% | 0.6% | 0.6% | 0.6% | 0.6% | 0.6% | 0.6% | 0.6% |
|---|
| Telefonica USA | 0.4% | 0.4% | 0.4% | 0.4% | 0.4% | 0.4% | 0.4% | 0.4% | 0.4% | 0.4% | 0.3% | 0.4% | 0.3% | 0.3% |
|---|
| Otecel | 0.3% | 0.3% | 0.3% | 0.3% | 0.3% | 0.3% | 0.3% | 0.2% | 0.2% | 0.2% | 0.2% | 0.2% | 0.2% | 0.2% |
|---|
| Telefónica El Salvador | 0.1% | 0.1% | 0.1% | 0.1% | 0.1% | 0.1% | 0.1% | 0.1% | 0.1% | 0.1% | 0.1% | 0.1% | 0.1% | 0.1% |
|---|
| Telefónica Uruguay | <0.1% | <0.1% | <0.1% | <0.1% | <0.1% | <0.1% | 0.1% | 0.1% | 0.1% | 0.1% | 0.1% | 0.1% | 0.1% | 0.1% |
|---|
The diagram shows only Telefónica Group subcategories with more than 1% usage.
 | Find more details in our extensive Telefónica Group market report. Learn more
|
Share this page |  LinkedIn
 Mastodon
 Bluesky