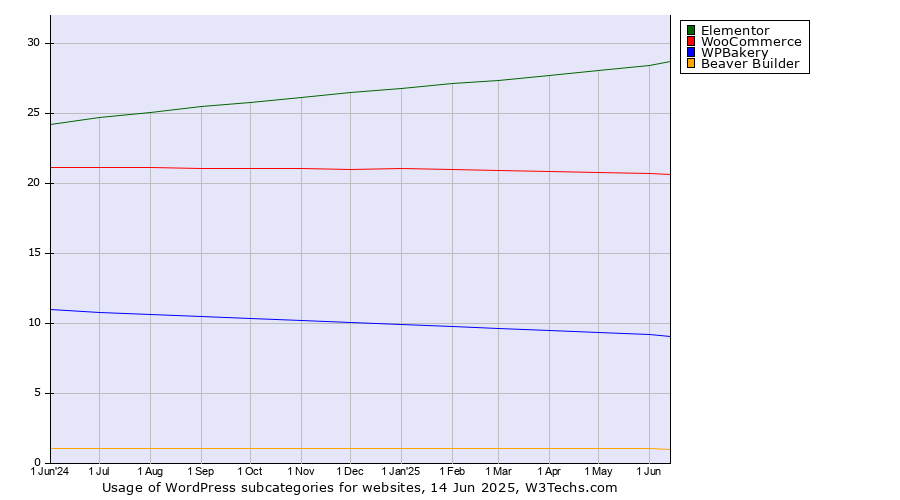
Technologies > Content Management > WordPress > Subtechnologies History > Monthly Historical trends in the usage statistics of WordPress subtechnologies for websitesThis report shows the historical trends in the usage of WordPress subtechnologies since June 2025. | 2025
1 Jun | 2025
1 Jul | 2025
1 Aug | 2025
1 Sep | 2025
1 Oct | 2025
1 Nov | 2025
1 Dec | 2026
1 Jan | 2026
1 Feb | 2026
1 Mar | 2026
1 Apr | 2026
1 May | 2026
1 Jun | 2026
16 Jun | | Elementor | 28.5% | 28.8% | 29.1% | 29.5% | 29.8% | 30.0% | 30.3% | 30.5% | 30.7% | 30.9% | 31.0% | 31.2% | 31.3% | 31.4% |
|---|
| WooCommerce | 20.7% | 20.6% | 20.5% | 20.5% | 20.4% | 20.4% | 20.4% | 20.4% | 20.2% | 20.2% | 20.1% | 19.9% | 19.9% | 19.8% |
|---|
| WPBakery | 9.2% | 9.1% | 8.9% | 8.8% | 8.7% | 8.6% | 8.4% | 8.3% | 8.2% | 8.1% | 8.0% | 7.8% | 7.7% | 7.7% |
|---|
| Beaver Builder | 1.0% | 1.0% | 1.0% | 1.0% | 1.0% | 1.0% | 1.0% | 1.0% | 1.0% | 1.0% | 1.0% | 1.0% | 1.0% | 1.0% |
|---|
| 10Web Photo Gallery | 0.7% | 0.7% | 0.7% | 0.7% | 0.7% | 0.7% | 0.7% | 0.7% | 0.7% | 0.6% | 0.6% | 0.6% | 0.6% | 0.6% |
|---|
| NextGEN Gallery | 0.5% | 0.5% | 0.5% | 0.5% | 0.5% | 0.5% | 0.5% | 0.5% | 0.5% | 0.5% | 0.5% | 0.5% | 0.5% | 0.5% |
|---|
| Oxygen | 0.4% | 0.4% | 0.4% | 0.4% | 0.4% | 0.4% | 0.4% | 0.4% | 0.4% | 0.4% | 0.4% | 0.4% | 0.4% | 0.4% |
|---|
| Bricks | 0.2% | 0.2% | 0.2% | 0.2% | 0.2% | 0.3% | 0.3% | 0.3% | 0.3% | 0.3% | 0.3% | 0.3% | 0.3% | 0.3% |
|---|
| bbPress | 0.3% | 0.3% | 0.3% | 0.3% | 0.3% | 0.3% | 0.3% | 0.3% | 0.3% | 0.2% | 0.2% | 0.2% | 0.2% | 0.2% |
|---|
| FooGallery | 0.2% | 0.2% | 0.2% | 0.2% | 0.2% | 0.2% | 0.2% | 0.2% | 0.2% | 0.2% | 0.2% | 0.2% | 0.2% | 0.2% |
|---|
| Thrive Architect | | | 0.3% | 0.3% | 0.3% | 0.2% | 0.2% | 0.2% | 0.2% | 0.2% | 0.2% | 0.2% | 0.2% | 0.2% |
|---|
| Breakdance | 0.1% | 0.1% | 0.1% | 0.1% | 0.1% | 0.1% | 0.1% | 0.2% | 0.2% | 0.2% | 0.2% | 0.2% | 0.2% | 0.2% |
|---|
The diagram shows only WordPress subtechnologies with more than 1% usage.
 | Find more details in our extensive WordPress market report. Learn more
|
Share this page | 
 LinkedIn
 Mastodon
 Bluesky