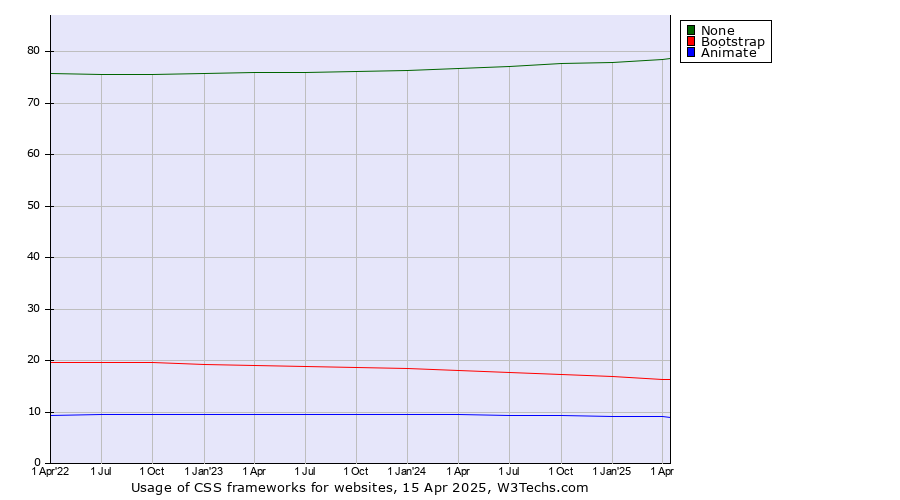
Technologies > CSS Frameworks > Usage Trend > Quarterly Historical quarterly trends in the usage statistics of css frameworks for websitesThis report shows the historical trends in the usage of the top CSS frameworks since July 2023. | 2023
1 Jul | 2023
1 Oct | 2024
1 Jan | 2024
1 Apr | 2024
1 Jul | 2024
1 Oct | 2025
1 Jan | 2025
1 Apr | 2025
1 Jul | 2025
1 Oct | 2026
1 Jan | 2026
1 Apr | 2026
1 Jul | 2026
13 Jul | | None | 76.0% | 76.2% | 76.4% | 76.7% | 77.2% | 77.6% | 77.9% | 78.5% | 78.9% | 79.3% | 79.9% | 80.4% | 81.2% | 81.2% |
|---|
| Bootstrap | 18.9% | 18.7% | 18.5% | 18.1% | 17.7% | 17.3% | 16.9% | 16.4% | 16.0% | 15.6% | 15.1% | 14.6% | 14.0% | 14.0% |
|---|
| Animate | 9.4% | 9.4% | 9.5% | 9.4% | 9.4% | 9.3% | 9.2% | 9.0% | 8.9% | 8.8% | 8.6% | 8.3% | 8.0% | 8.0% |
|---|
| Foundation | 0.5% | 0.5% | 0.5% | 0.5% | 0.5% | 0.5% | 0.5% | 0.4% | 0.5% | 0.5% | 0.5% | 0.5% | 0.4% | 0.4% |
|---|
| Tailwind | 0.1% | 0.1% | 0.1% | 0.1% | 0.2% | 0.2% | 0.2% | 0.2% | 0.2% | 0.3% | 0.3% | 0.3% | 0.3% | 0.3% |
|---|
| UIkit | 0.2% | 0.2% | 0.2% | 0.2% | 0.2% | 0.2% | 0.2% | 0.2% | 0.2% | 0.2% | 0.2% | 0.2% | 0.2% | 0.2% |
|---|
| Skeleton | 0.1% | 0.1% | 0.1% | 0.1% | 0.1% | 0.1% | 0.1% | 0.1% | 0.1% | 0.1% | 0.1% | 0.1% | 0.1% | 0.1% |
|---|
| Materialize | 0.1% | 0.1% | 0.1% | 0.1% | 0.1% | 0.1% | 0.1% | 0.1% | 0.1% | 0.1% | 0.1% | 0.1% | 0.1% | 0.1% |
|---|
| Material Design Lite | 0.1% | 0.1% | 0.1% | 0.1% | 0.1% | 0.1% | 0.1% | 0.1% | 0.1% | 0.1% | 0.1% | 0.1% | 0.1% | 0.1% |
|---|
| Semantic UI | 0.1% | 0.1% | 0.1% | 0.1% | 0.1% | 0.1% | 0.1% | 0.1% | 0.1% | 0.1% | 0.1% | <0.1% | <0.1% | <0.1% |
|---|
| Bulma | 0.1% | <0.1% | <0.1% | <0.1% | <0.1% | <0.1% | <0.1% | <0.1% | <0.1% | <0.1% | <0.1% | <0.1% | <0.1% | <0.1% |
|---|
The diagram shows only CSS frameworks with more than 1% usage.
 | Find more details in our extensive CSS frameworks market reports. Learn more
|
Share this page | 

 LinkedIn
 Mastodon
 Bluesky