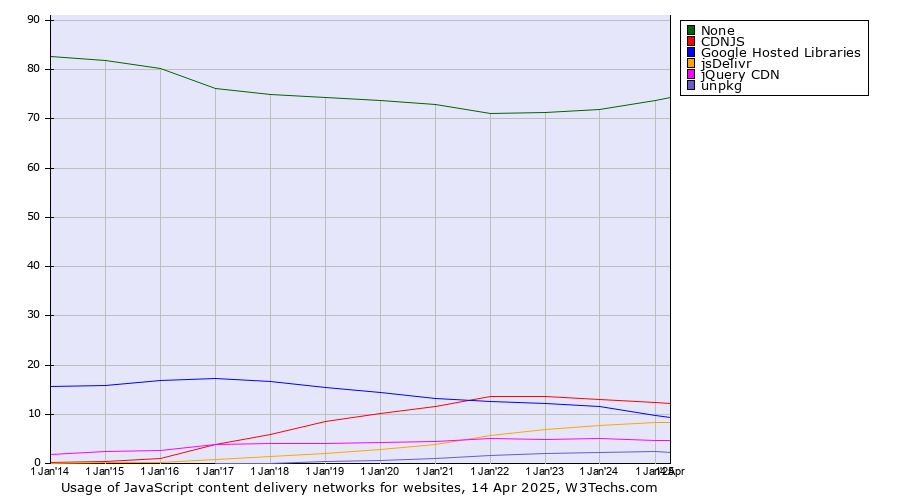
Technologies > Content Delivery > Usage Trend > Yearly Historical yearly trends in the usage statistics of javascript content delivery networks for websitesThis report shows the historical trends in the usage of the top JavaScript content delivery networks since January 2014. | 2014
1 Jan | 2015
1 Jan | 2016
1 Jan | 2017
1 Jan | 2018
1 Jan | 2019
1 Jan | 2020
1 Jan | 2021
1 Jan | 2022
1 Jan | 2023
1 Jan | 2024
1 Jan | 2025
1 Jan | 2025
23 Sep | | None | 82.6% | 81.8% | 80.2% | 76.2% | 75.0% | 74.3% | 73.7% | 73.0% | 71.2% | 71.4% | 71.8% | 73.8% | 74.8% |
|---|
| CDNJS | 0.2% | 0.4% | 1.0% | 3.9% | 6.0% | 8.5% | 10.1% | 11.7% | 13.7% | 13.6% | 13.1% | 12.4% | 12.3% |
|---|
| Google Hosted Libraries | 15.6% | 15.8% | 16.9% | 17.2% | 16.6% | 15.5% | 14.4% | 13.2% | 12.6% | 12.2% | 11.5% | 9.8% | 8.7% |
|---|
| jsDelivr | <0.1% | 0.1% | 0.2% | 0.9% | 1.3% | 1.9% | 2.8% | 3.8% | 5.7% | 6.8% | 7.8% | 8.3% | 8.7% |
|---|
| jQuery CDN | 1.8% | 2.5% | 2.7% | 3.9% | 4.1% | 4.1% | 4.3% | 4.4% | 5.0% | 4.9% | 5.0% | 4.7% | 4.4% |
|---|
| unpkg | | | | <0.1% | 0.1% | 0.3% | 0.6% | 1.0% | 1.6% | 2.0% | 2.2% | 2.4% | 2.4% |
|---|
| Yandex Libraries Hosting | | | | 0.7% | 0.7% | 0.6% | 0.6% | 0.7% | 0.6% | 0.7% | 0.6% | 0.5% | 0.4% |
|---|
| Microsoft Ajax CDN | 0.2% | 0.3% | 0.3% | 0.5% | 0.5% | 0.4% | 0.4% | 0.4% | 0.4% | 0.4% | 0.4% | 0.3% | 0.2% |
|---|
| BootCDN | | | | | | | 0.1% | 0.1% | 0.1% | 0.1% | 0.1% | 0.1% | <0.1% |
|---|
| StaticFile | | <0.1% | <0.1% | <0.1% | <0.1% | <0.1% | <0.1% | <0.1% | <0.1% | 0.1% | 0.1% | <0.1% | <0.1% |
|---|
| Baidu Resource Library | | | | 0.1% | 0.1% | 0.1% | 0.1% | <0.1% | <0.1% | 0.1% | <0.1% | <0.1% | <0.1% |
|---|
| Yahoo API CDN | 0.1% | 0.1% | <0.1% | <0.1% | <0.1% | <0.1% | <0.1% | <0.1% | <0.1% | <0.1% | <0.1% | <0.1% | <0.1% |
|---|
| RawGit | | | | | 0.2% | 0.2% | 0.2% | 0.2% | | | | | |
|---|
The diagram shows only JavaScript content delivery networks with more than 1% usage.
 | Find more details in our extensive JavaScript content delivery networks market reports. Learn more
|
Share this page |  LinkedIn
 Mastodon
 Bluesky