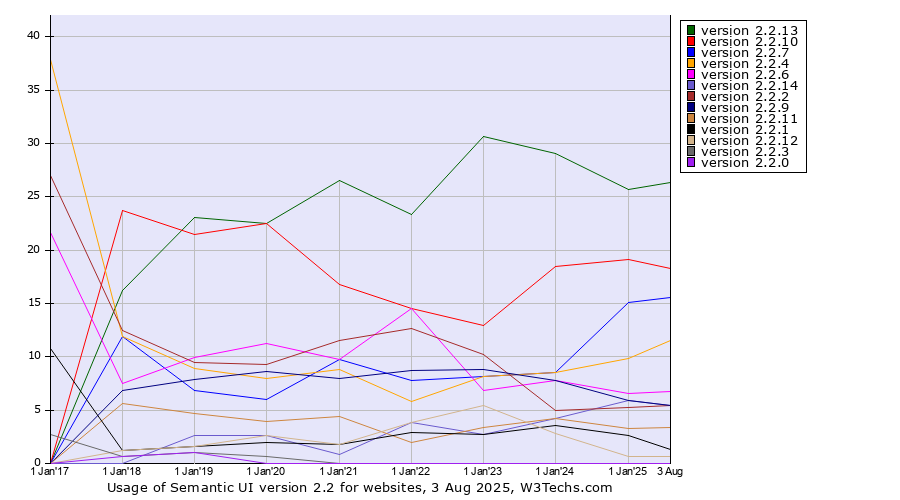
Technologies > JavaScript Libraries > Semantic UI > Version 2.2 > Version History > Yearly Historical yearly trends in the usage statistics of Semantic UI version 2.2 for websitesThis report shows the historical trends in the usage of subversions of Semantic UI Version 2.2 since January 2017. | 2017
1 Jan | 2018
1 Jan | 2019
1 Jan | 2020
1 Jan | 2021
1 Jan | 2022
1 Jan | 2023
1 Jan | 2024
1 Jan | 2025
1 Jan | 2025
19 Jun | | version 2.2.13 | | 16.2% | 23.0% | 22.5% | 26.5% | 23.3% | 30.6% | 29.1% | 25.7% | 25.2% |
|---|
| version 2.2.10 | | 23.8% | 21.5% | 22.5% | 16.8% | 14.6% | 12.9% | 18.4% | 19.1% | 18.5% |
|---|
| version 2.2.7 | | 11.9% | 6.8% | 6.0% | 9.7% | 7.8% | 8.2% | 8.5% | 15.1% | 17.2% |
|---|
| version 2.2.4 | 37.8% | 11.9% | 8.9% | 7.9% | 8.8% | 5.8% | 8.2% | 8.5% | 9.9% | 11.3% |
|---|
| version 2.2.6 | 21.6% | 7.5% | 9.9% | 11.3% | 9.7% | 14.6% | 6.8% | 7.8% | 6.6% | 7.3% |
|---|
| version 2.2.14 | | | 2.6% | 2.6% | 0.9% | 3.9% | 2.7% | 4.3% | 5.9% | 5.3% |
|---|
| version 2.2.2 | 27.0% | 12.5% | 9.4% | 9.3% | 11.5% | 12.6% | 10.2% | 5.0% | 5.3% | 5.3% |
|---|
| version 2.2.9 | | 6.9% | 7.9% | 8.6% | 8.0% | 8.7% | 8.8% | 7.8% | 5.9% | 5.3% |
|---|
| version 2.2.11 | | 5.6% | 4.7% | 4.0% | 4.4% | 1.9% | 3.4% | 4.3% | 3.3% | 2.6% |
|---|
| version 2.2.1 | 10.8% | 1.2% | 1.6% | 2.0% | 1.8% | 2.9% | 2.7% | 3.5% | 2.6% | 1.3% |
|---|
| version 2.2.12 | | 1.2% | 1.6% | 2.6% | 1.8% | 3.9% | 5.4% | 2.8% | 0.7% | 0.7% |
|---|
| version 2.2.3 | 2.7% | 0.6% | 1.0% | 0.7% | | | | | | |
|---|
The diagram shows only Semantic UI versions with more than 1% usage.
 | Find more details in our extensive Semantic UI market report. Learn more
|
Share this page |  LinkedIn
 Mastodon
 Bluesky