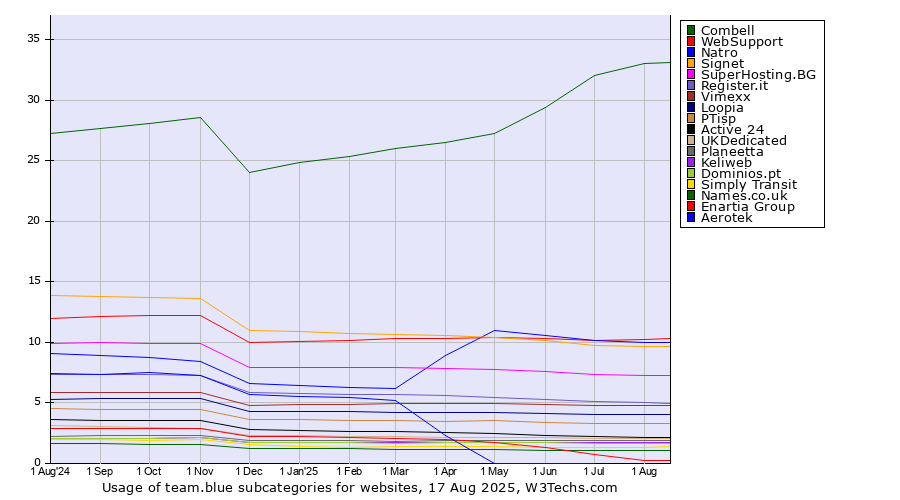
Technologies > Data Centers > team.blue > Subcategories History > Monthly Historical trends in the usage statistics of team.blue subcategories for websitesThis report shows the historical trends in the usage of team.blue subcategories since September 2024. | 2024
1 Sep | 2024
1 Oct | 2024
1 Nov | 2024
1 Dec | 2025
1 Jan | 2025
1 Feb | 2025
1 Mar | 2025
1 Apr | 2025
1 May | 2025
1 Jun | 2025
1 Jul | 2025
1 Aug | 2025
1 Sep | 2025
20 Sep | | Combell | 27.7% | 28.0% | 28.6% | 24.0% | 24.9% | 25.4% | 26.0% | 26.5% | 27.3% | 29.4% | 32.1% | 33.0% | 33.1% | 33.2% |
|---|
| WebSupport | 12.1% | 12.2% | 12.3% | 10.0% | 10.1% | 10.2% | 10.3% | 10.3% | 10.4% | 10.3% | 10.2% | 10.3% | 10.3% | 10.3% |
|---|
| Natro | 8.9% | 8.7% | 8.5% | 6.6% | 6.5% | 6.3% | 6.2% | 8.9% | 11.0% | 10.6% | 10.2% | 10.0% | 9.9% | 9.9% |
|---|
| Signet | 13.8% | 13.7% | 13.6% | 11.0% | 10.9% | 10.7% | 10.7% | 10.6% | 10.4% | 10.1% | 9.8% | 9.7% | 9.6% | 9.6% |
|---|
| SuperHosting.BG | 10.0% | 9.9% | 9.9% | 8.0% | 7.9% | 7.9% | 7.9% | 7.8% | 7.7% | 7.6% | 7.3% | 7.3% | 7.2% | 7.2% |
|---|
| Register.it | 7.4% | 7.3% | 7.3% | 5.8% | 5.8% | 5.7% | 5.7% | 5.6% | 5.5% | 5.3% | 5.1% | 5.0% | 4.9% | 4.9% |
|---|
| Vimexx | 5.8% | 5.8% | 5.9% | 4.8% | 4.8% | 4.9% | 4.9% | 4.9% | 4.9% | 4.9% | 4.8% | 4.8% | 4.8% | 4.8% |
|---|
| Loopia | 5.3% | 5.3% | 5.3% | 4.3% | 4.3% | 4.3% | 4.2% | 4.2% | 4.2% | 4.1% | 4.0% | 4.0% | 4.1% | 4.1% |
|---|
| PTisp | 4.5% | 4.4% | 4.5% | 3.6% | 3.6% | 3.6% | 3.5% | 3.5% | 3.5% | 3.4% | 3.3% | 3.3% | 3.3% | 3.3% |
|---|
| Simply Transit | 2.0% | 1.9% | 1.9% | 1.6% | 1.4% | 1.4% | 1.4% | 1.4% | 1.4% | 1.3% | 1.3% | 1.4% | 1.9% | 2.8% |
|---|
| Active 24 | 3.6% | 3.6% | 3.5% | 2.8% | 2.8% | 2.7% | 2.6% | 2.6% | 2.5% | 2.4% | 2.2% | 2.2% | 2.1% | 2.1% |
|---|
| Planeetta | 2.3% | 2.3% | 2.3% | 1.9% | 1.9% | 1.9% | 1.8% | 1.9% | 1.9% | 1.9% | 1.9% | 1.9% | 1.9% | 1.9% |
|---|
The diagram shows only team.blue subcategories with more than 1% usage.
 | Find more details in our extensive team.blue market report. Learn more
|
Share this page |  LinkedIn
 Mastodon
 Bluesky