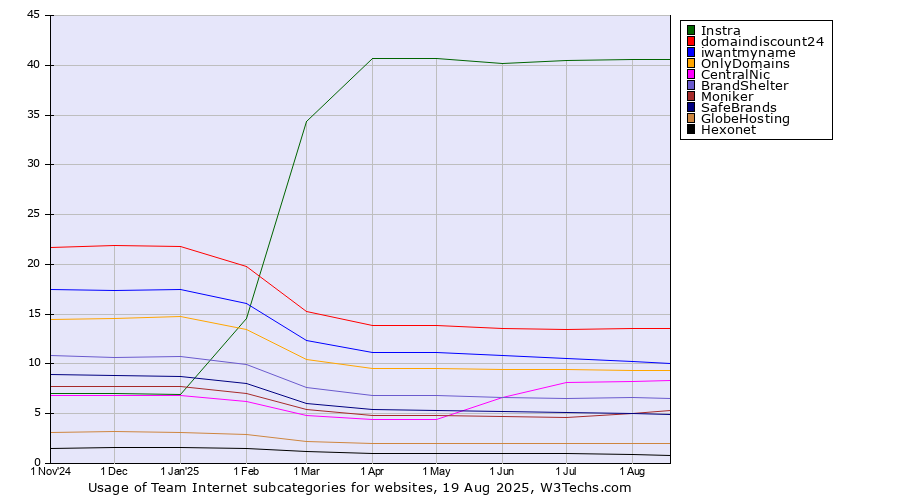
Technologies > DNS Servers > Team Internet > Subcategories History Historical trends in the usage statistics of Team Internet subcategories for websitesThis report shows the historical trends in the usage of Team Internet subcategories since November 2024. | 2024
1 Nov | 2024
1 Dec | 2025
1 Jan | 2025
1 Feb | 2025
1 Mar | 2025
1 Apr | 2025
1 May | 2025
1 Jun | 2025
1 Jul | 2025
1 Aug | 2025
1 Sep | 2025
1 Oct | 2025
31 Oct | | Instra | 7.0% | 7.0% | 7.0% | 14.6% | 34.4% | 40.7% | 40.7% | 40.2% | 40.5% | 40.6% | 40.6% | 40.7% | 40.8% |
|---|
| domaindiscount24 | 21.7% | 21.9% | 21.8% | 19.8% | 15.3% | 13.9% | 13.9% | 13.6% | 13.5% | 13.5% | 13.6% | 13.6% | 13.8% |
|---|
| BrandShelter | 10.8% | 10.7% | 10.7% | 10.0% | 7.6% | 6.8% | 6.8% | 6.6% | 6.5% | 6.6% | 6.6% | 11.6% | 11.5% |
|---|
| iwantmyname | 17.5% | 17.4% | 17.5% | 16.1% | 12.4% | 11.2% | 11.2% | 10.9% | 10.6% | 10.2% | 10.0% | 9.7% | 9.3% |
|---|
| OnlyDomains | 14.4% | 14.6% | 14.7% | 13.5% | 10.4% | 9.5% | 9.6% | 9.4% | 9.4% | 9.3% | 9.3% | 9.3% | 9.3% |
|---|
| CentralNic | 6.8% | 6.8% | 6.8% | 6.3% | 4.9% | 4.4% | 4.4% | 6.6% | 8.1% | 8.3% | 8.3% | 8.4% | 8.5% |
|---|
| Moniker | 7.8% | 7.7% | 7.7% | 7.1% | 5.4% | 4.8% | 4.8% | 4.7% | 4.6% | 5.0% | 5.5% | 5.6% | 5.6% |
|---|
| GlobeHosting | 3.1% | 3.2% | 3.1% | 2.9% | 2.2% | 2.0% | 2.0% | 2.0% | 2.0% | 2.0% | 2.0% | 2.0% | 2.0% |
|---|
| Hexonet | 1.5% | 1.6% | 1.6% | 1.5% | 1.2% | 1.0% | 1.0% | 1.0% | 1.0% | 0.9% | 0.7% | 0.7% | 0.7% |
|---|
| Key-Systems | 0.3% | 0.3% | 0.3% | 0.2% | 0.2% | 0.2% | 0.2% | 0.1% | 0.1% | 0.1% | 0.1% | 0.1% | 0.1% |
|---|
| SafeBrands | 9.0% | 8.9% | 8.8% | 8.0% | 6.1% | 5.4% | 5.4% | 5.2% | 5.1% | 5.0% | 5.0% | | |
|---|
The diagram shows only Team Internet subcategories with more than 1% usage.
 | Find more details in our extensive Team Internet market report. Learn more
|
Share this page |  LinkedIn
 Mastodon
 Bluesky